
Welcome back for Part 2 of this series on statistics and the Iowa Senate Race.
Find the other articles in this series here: Part 1, Part 3, Part 4, Part 5, and a brief update. And the final update—Why Joni Ernst will be the next US Senator from Iowa.
Today, we develop a model to project voter registration in Iowa this November.
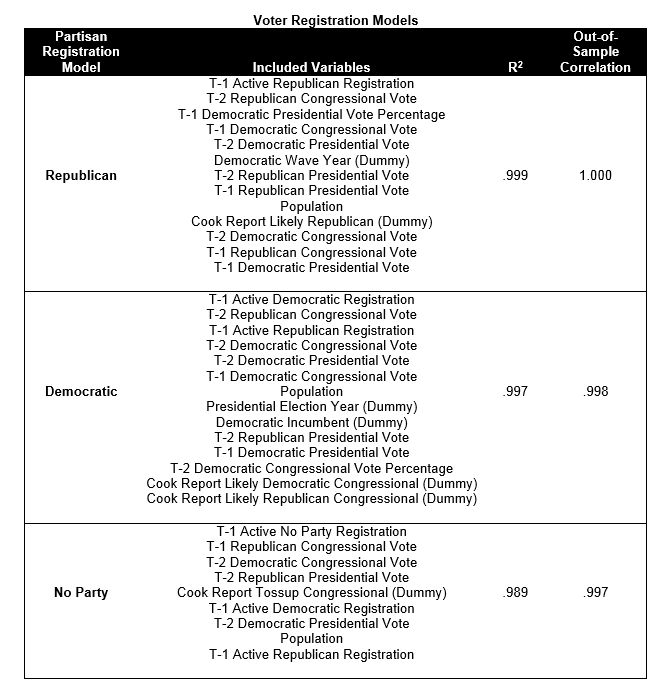
Based on what we know about registration behavior, it is possible to build a statistical model that predicts the behavior of potential voters in both parties in the past and future. In order to do this, I used a data-mining technique called step-wise linear regression, which selects from a wide range of potential variables to find a model that best fits the data. While this can occasionally lead to over-fitting (weighting data to focus too heavily on past results), I have worked to resolve this problem through a large sample size of county-level data and using out-of-sample testing to gauge fit. The table below presents these three registration models, the variables selected for the model, the model’s fit on the data (R2), and the model’s correlation to out-of-sample data. From a statistical perspective, each model fits very well with the historical data.
The models above allow us to make predictions of county-level data based primarily on lagged data of past Congressional and Presidential votes, along with several dummy variables describing particular political conditions. Each model selected variables mainly from the lagged data, and interestingly, while statistically significant in some of the prior regressions discussed yesterday, the economic and Congressional approval variables were excluded from these models. This may suggest Iowans are not as concerned as previously argued about personal finances in the voting booth, but that is unlikely to be the case. Variables in the models reflecting wave years for both parties and Cook Report ratings have high correlations to economic conditions. So economics are a key factor in Iowans’ registration decisions, they just don’t present themselves directly in the models. The reason wave variables were coded into the data is that wave years see major spikes in partisan registration, so it was necessary to control for these changes. Wave elections are fairly easy to predict before they happen, and at present, another wave year seems unlikely for either party, especially considering the way district maps have been redrawn. If Republicans retake the Senate this year, it will likely have more to do with Democrats needing to defend more seats on a tough map rather than voters moving toward the GOP. The Cook Report variables are the only qualitative variables in the data set, but it can be very valuable to use expert forecasting opinion in models. In this case, they proved statistically significant in each model. These Cook variables provide important insight into the validity of the arguments being made by the campaigns, the opposition research flowing through the airwaves, and other electoral factors that cannot easily be quantified.
The models are actually more noteworthy for what they exclude than for what they include. Noticeably absent are any variables related to campaign spending. Voter registration is often a key function of campaigns, which can be far more effective if they have adequate funding. So logic would seem to indicate campaign spending should be in the model, but the correlation between campaign expenditures and voter registration is effectively zero. This surprising result will be discussed in depth later.
Click to view full chart.
What is particularly noteworthy here is that we are examining the data in aggregate, so while we would expect to see errors in every county-level prediction, those errors average to zero across the full sample, assuming the errors are normally distributed. The aggregate of 99 counties, therefore, should provide a prediction that very nearly approximates the actual trend in voter registration. Registration projections may update as the election draws closer because each model is based on current data, but the predictions should not change substantially because very few variables will fluctuate.
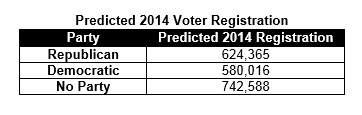
The table below provides the models’ predicted registration numbers for 2014. It projects that both parties will see drops in registration levels from the 2012 election. Democrats will suffer heavier losses. The model indicates Democratic registration may be more negatively impacted in mid-term elections than registration for Republicans or no-party voters. The projection that is most likely to interest political operatives statewide is the sharp rise projected in no-party voters. It is difficult to pinpoint a precise cause for this trend, but the model seems to indicate no-party voters may increase in response to prior partisan registration spikes, possibly related to presidential caucuses. The GOP had a rise in registration in 2012, and Democrats saw tremendous gains in 2008. Ever since 2008, Democrats have seen a downward trend from voters either changing registration or falling off the active voter rolls, possibly a result of moving to a new location.
So what is the impact of these projected registration numbers on the race for Senate?
First, we consider the GOP primary. Registration during the primary can be viewed as the universe of potential primary voters. Campaigns, which are almost always short of time and resources, will put most of their effort into reaching the voters most likely to vote in a Republican primary, which are the voters already registered as Republicans. This presents a universe of around 624,000 voters. This projection is technically for the November 2014 general election because building a time series that would project primary registration is unlikely to yield accurate results. Currently, GOP Registration is just over 600,000.
It’s also extraordinarily difficult to project the proportion of registered voters who may cast a ballot. Last year’s GOP presidential caucuses had a record turnout of approximately 122,000. There will be less excitement surrounding the GOP primary this June than there was in last year’s presidential campaign, but if we look back on other recent non-presidential primaries, turnout ranges from as few as 85,000 to as many as 230,000. This wide range combined with other factors at play, such as competitiveness of the race and excitement generated by the candidates, along with a small sample size of comparable races, makes it impossible to build a reliable model of turnout in the primary without reaching far beyond the scope of publicly available data.
The real challenge faced by the campaigns in working off of the same list of approximately 600,000 registered Republicans is that they are all trying to appeal to the same voters. At best, maybe a third of that universe will show up to the polls, and currently, voters will have a choice between five candidates.
With a dogfight over this small universe of registered Republican voters, some of the candidates may find higher return on investment by targeting independent voters who typically support GOP candidates. Iowa allows voters to register for a party at the time they vote, so these independent voters, who outnumber registered Democrats and Republicans, are potentially a ripe source for primary voters if asked to vote by the right campaign.
Registration has equal importance in the general election. Both Democrats and Republicans will focus heavily on turning out the voters registered with their respective parties. Party registration saves the campaigns time because less work needs to be done identifying these voters. The campaigns have some certainty that a registered Democrat will vote for the Democratic candidate and vice versa. These voters don’t require a substantial amount of persuasion that a particular candidate is best, but the campaigns do need to get them to the polls. This was the key to the Obama campaign’s advantage in the 2012 election. They had a very successful turnout operation for registered Democrats, but even more important, they had carefully identified Obama supporters who were registered as no-party voters and got them to vote. This was ultimately a key factor that led the Romney campaign to overestimate its success in the early vote leading up to Election Day. There was an assumption that the no-party vote would be divided similarly to how polling indicated—somewhat evenly. In reality, no-party voters who cast early ballots were mostly Obama supporters.
While all of the campaigns in the Senate race are likely to draw on lessons from the Obama operation, it will require substantial resources to accurately identify no-party voters ahead of Election Day—resources that most Senate campaigns lack. Perhaps an even greater challenge is that presidential races generate constant media coverage and highly-saturated airwaves. Voters made up their minds in 2012 well before Election Day. That won’t be the case in 2014. Persuasion that one candidate is the better choice will need to be a key focus for each campaign, and only once a campaign knows how a no-party voter will behave at the polls will they actually want that individual to vote.
While Republicans are projected to have a registration lead at the time of the general election, the registration gap should hardly make Republicans feel secure. The winner of the Iowa Senate race will largely be based on the percentage of turnout by registered voters of each party, but even more on how the remaining 743,000 no-party voters break. And this should make Republicans very nervous…
Tune in tomorrow as I analyze why Democrats have an undeniable advantage in the 2014 Senate race.