
Today, we begin a five-part series, running all week, on the U.S. Senate race in Iowa.
Find the other articles in this series here: Part 2, Part 3, Part 4, Part 5, and a brief update. And the final update—Why Joni Ernst will be the next US Senator from Iowa.
Republicans now see a path to the Senate Majority by picking up the seat of retiring Democratic Senator Tom Harkin. This feat seemed unlikely until a gaffe in March by Democrat Bruce Braley, who was caught on video making remarks that Republicans claim insulted farmers. Polling now shows the race tightening, but polls are never to be trusted this far from November. Over the course of this series, I’ll present an in-depth statistical exploration of the advantages and disadvantages each party faces.
I will offer as a full disclaimer that Iowa is a state I know well. I was the Communications Director for Mitt Romney’s campaign in Iowa during the 2012 election. And while I have a history as a Republican operative, I think all readers will find this analysis to be unbiased. My goal in writing is to present an objective understanding of this race through statistical analysis.
Iowa seems to fit perfectly within the definition of a swing state. While it went for Obama in the past two presidential elections, it also voted for Bush in 2004. Governor Terry Branstad, who is poised for reelection in 2014, was preceded by two Democrats. The Congressional delegation is divided evenly—one Senator from each party and two Representatives from each party. The state House and Senate are almost evenly divided in both chambers, with Republicans controlling the House and Democrats the Senate.
But Iowa has clearly seen a shift toward Democrats in recent years. For much of the past two decades, Republicans either controlled all five seats in the House delegation or at least four of five. This ended in 2006 when the first and second congressional districts elected Democrats for the first time since the 1970s. While Iowa may have voted for Bush in 2004, Obama won in 2008 by 9.5%, a much larger margin than other “swing states” like Ohio or Florida, which had 4.5% and 2.8% margins, respectively. It could be argued that the high margin for Obama in 2008 was the result of Obama’s presence in Iowa throughout the caucuses and the excitement that generated for his campaign. As the spokesman for Romney’s 2012 campaign in Iowa, I made the case continuously that the “thrill” of 2008 had sunk from Obama’s campaign as a result of disappointment with his policies. The anecdotal evidence abounded as the crowds at Obama events were a fraction of four years earlier and the giddy, youthful volunteers were nowhere to be seen. The Romney campaign felt confident heading into Election Day. While we were not positive we would win, we did not expect to lose by a full 5.8%. It was an improvement from 9.5%, but it was a disappointment after the endless hours our campaign team fought for victory.
A year and a half since that loss for the GOP, Iowa is now gearing up for the 2014 midterms. Not much will change in the state. The forecasters at the Cook Political Report, who evaluate candidates nationwide, believe that Governor Branstad will be reelected and with the potential exception of IA-03, all the House districts will remain in the hands of their current parties.
Many observers are beginning to believe that the U.S. Senate race is particularly competitive. The open Senate seat is being vacated by Tom Harkin. This is the first time Iowa has voted on an open Senate seat in 30 years, and while the Cook Report believes the race currently leans in favor of Democrat Bruce Braley, we remain six months from the election. Polling indicates the race is close, but this far out, no candidate from either party is well known by the statewide electorate.
This Senate race raises a wide range of questions for political observers. Do the past two presidential elections indicate an advantage for Democrats statewide in federal races? How much impact has Democrats’ registration advantage played in prior elections? Are Democrats better at turning out their supporters? Will the current anger with both the President and Congress affect turnout on either side? How much money will the Senate campaigns need to raise? If the GOP loses, is that because Iowa favors Democrats or instead the result of a weak state party and poor candidate fundraising?
I set out to examine the answers to these questions from my perspective as both a statistician and campaign strategist. I constructed a data set that reflects political conditions, registration, turnout, polling, and economic data dating back to 1996. All the models developed reflect data from all the cycles in the dataset.
While many election models are based on statewide projections, these models are built on county-level data, which increases the sample size. Additionally, geography can be a powerful predictor of vote choice because of a high correlation with demography. I focus extensively on what the data tell us about past elections, but I also look ahead to 2014. The predictive models presented in this series offer a simplified picture of a very complicated world. It is, of course, important to remember that no model will ever be perfectly accurate, but I am confident in these predictions if current macroeconomic and political conditions hold. Each model was also tested on out-of-sample data, which I will discuss in more detail on other days. The out-of-sample tests proved to be far more accurate than I had hoped.
Below is an outline of what to expect throughout the week. Today we begin addressing registration…
Monday: What Factors Determine Iowa Voter Registration?
Tuesday: A Model of Voter Registration in the 2014 Iowa Senate Race
Wednesday: The Undeniable Democratic Advantage in the 2014 Iowa Senate Race
Thursday: Will Obama’s Approval Ratings Hurt Braley?
Friday: What Will Happen In November?
What Factors Determine Voter Registration?
Voter registration is an essential function of any campaign field operation, and as we analyze the intricacies of this Senate race, we’ll simultaneously consider the implications for both the GOP primary and ultimately the general election. (With Braley remaining unchallenged for the Democratic nomination, registration is of less relevance on the Democratic side during the primary). Registration, as will be discussed later, is influenced less by political conditions than turnout, but we will look at registration first because it is a key lever in the election for which campaigns may have some level of control.
The graph below provides a glimpse at the active registration numbers, by party, for each election dating back to 2000. Note that projections for 2014 are included in this graph, and we will examine tomorrow the basis for these numbers. No-party voters outnumber partisan voters in each of these election cycles, generally remaining between 700,000 and 750,000 voters. Democrats and Republicans have maintained near parity throughout most of this time. The key exception is the spike in Democratic registration around 2008, best explained by the attention given to the Democratic caucuses in Iowa and disapproval of the Bush Administration. This record Democratic registration has trended downward ever since. On average, both parties maintain somewhere around 600,000 voters, significantly fewer than the no-party voters.

Click to view full graph
The base level amongst these three registration choices is well beyond the scope of this essay and gets deep into psychology and political science, but the fluctuations that we see in this graph are primarily dependent on changes in the political climate both nationally and within the state of Iowa. To examine the causes of these fluctuations, regressions were run on the county-level data to pinpoint what has a statistically significant impact. In order to conduct this analysis, it was important to control for the population of each county and the previous election cycle’s registration numbers for the party in question. I then considered data that political strategists would want to examine when evaluating a campaign.
It is essential to view the economic climate. In this study, I used three variables: Iowa unemployment, national unemployment, and national consumer sentiment. From the statistician’s perspective, some concern is raised over the high correlation between these three numbers, but the tests showed distinct differences in how voters view the data. Republican registration was affected by all three of these variables. Democratic registration was affected by both Iowa unemployment and national unemployment, though it is important to note that for both Democrats and Republicans, national unemployment had a small negative effect while Iowa unemployment had a large positive effect. Iowa unemployment is what is most important to these partisan voters in economic terms.
Consumer economics is particularly interesting for no-party voters. National unemployment is not statistically significant in determining no-party registration; however, Iowa unemployment and national consumer sentiment have a positive, statistically significant effect on registration. Independent-minded Iowans respond to the economic conditions they and their neighbors are experiencing.
Three other variables were tested, as well. The first was a race competitiveness variable. This was designed to encompass several factors that campaign operatives will traditionally weigh when considering interest in an election. For example, presidential elections generate high turnout. Gubernatorial and Senate races are high-profile, and competitive house races are generally followed closely by voters. These factors were combined into a single variable that factored in the presence of other campaigns on the ballot and the Cook Report rating, which weighs candidate quality, fundraising, and other factors. Race competitiveness was only statistically significant for Republican voters. Even then, it surprisingly had a slightly negative impact on turnout. This may have more to do with the sample size of the elections in the dataset than anything else.
The final two variables considered public approval of Congress. These variables used polling numbers for voter approval of a particular party minus voter disapproval of that same party. In polling terms, political operatives never want to see this number sink into negative territory. That would put a candidate or party “under water.” Both parties have been under water since roughly 2004. These variables were statistically significant for partisan voters but not for no-party voters. Oddly, the signs for the variables are the same for each party. In other words, when Democratic Congressional approval is lowest, voter registration drops in both parties. When Republican disapproval is at its lowest, registration increases in both parties. Conservative Republicans have long argued the need to appeal to the base, as seen in the rise of the Tea Party, though this test indicates a substantially stronger registration gain for Democrats than Republicans when GOP disapproval is highest. This test did not indicate a statistically significant effect on no-party registration.
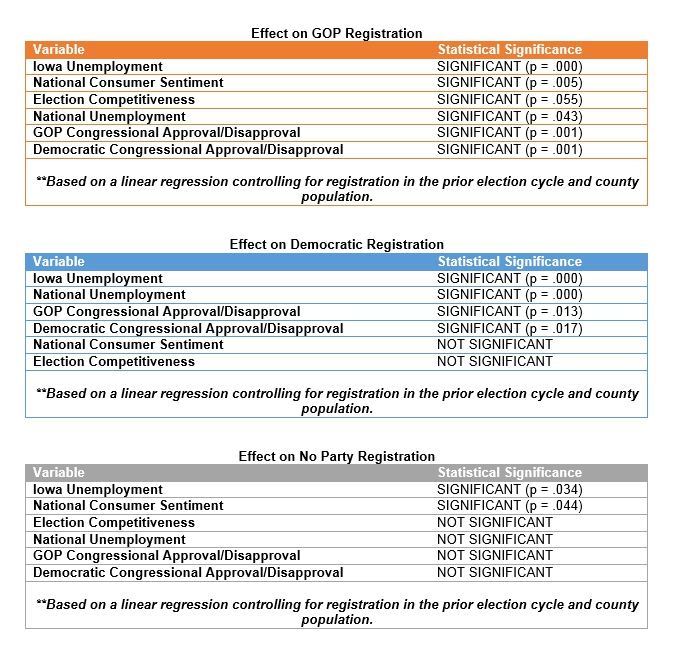
Click to view full regression results
This series will return tomorrow with a projection of November turnout in Iowa.