Editor’s Note: For another viewpoint, see Counterpoint: This Is the Worst Possible Time for Disasters
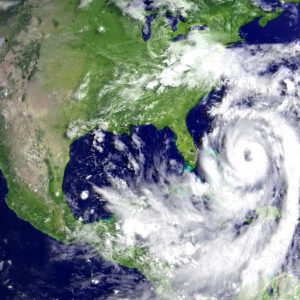
Phil Klotzbach and his crew at Colorado State University are out with their first prediction for the 2020 Atlantic hurricane season and it looks like a good year for The Weather Channel and something other than coronavirus on the news.
He’s predicting 16 named storms this season, versus the average of 12. We’ve already had two very weak ones, which is typical of May cyclones. Indications in his forecast are also for an above-normal number of major hurricanes (Category 3 or higher), and there is an elevated probability for a U.S. strike.
If this verifies, 2020 will be the fifth consecutive year with an above-normal frequency. But hurricanes are like baseball players (remember them?) in their streakiness. Until 2017, Hurricane Harvey hit near Corpus Christi, Texas, as a strong Category 4 storm, no Category 3 or higher hurricane eye had crossed a U.S. coastline for nearly 12 years.
That’s the longest major hurricane “drought” on record. Good records go back to the mid-19th century, and even before then the history is OK because it’s hard to miss a Category 3 landfall.
The year before the drought began, 2005, saw a record 27 named storms, including the monstrous Katrina, which unleashed the deepest U.S. coastal inundation in known history, and Wilma, besides being the last Category 3 strike until 2017, was (and remains) the most intense cyclone ever measured in the Atlantic Basin. (Related trivia: Accounting for coverage gaps, 1933 may have had the same number or more storms.)
So the picture emerges that Atlantic hurricane data is very noisy, and those with vested (and billion-dollar-funded) interests in pushing the horrific climate change meme can choose portions of longer data sets to tell pretty much any story (as can those with opposite predilections).
For example, the Third “National Assessment” of climate change effects on the United States, produced by the U.S. Global Change Research Program and published in 2014, featured a graphic showing a strong increase in the power of Atlantic hurricanes from 1980 to 2009.
Why didn’t they use data through 2013, which was available for the report? Because it destroyed the meme. Storm activity fell sharply after 2009, back to where it was in 1980.
The history they used started in 1970. But the diligent researchers at the National Hurricane Center, led by the aptly named Chris Landsea, scoured ship and other data to produce the record called HURDAT, going back to 1851. If it’s going to miss anything in the pre-satellite era that ended in 1970, it’s going to miss storms that spun harmlessly out at sea, or ones that fire up for a day or two and dissipate.
Ryan Maue, a brilliant meteorologist and graphic artist with BAMWX.com, has calculated the power of hurricanes every year, and the activity in the mid-20th century looks an awful lot like the relatively active recent decades (despite the lack of big ones hitting the United States for so long).
He’s also analyzed the global history, and it simply shows no trend related to the surface warming that began in the mid-1970s and flattened out in the early 21st century.
With regard to the Atlantic, the go-to paper, not surprisingly, was published by Phil Klotzbach in 2018 in the Bulletin of the American Meteorological Society (along with some really prestigious co-authors).
Called “Continental U.S. Hurricane Landfall Frequency and Associated Damage,” here’s how it starts: “While neither U.S. landfalling hurricane frequency nor intensity shows a significant trend since 1900, growth in coastal population and wealth have led to increasing hurricane-related damage along the U.S. coastline.”
So what do you do when a true authority like Klotzbach issues a forecast of more and stronger hurricanes for this season? First, you need to look at the record of his April forecast model. While it certainly produces better results than simply assuming the average from year-to-year, it explains about 40 percent of the annual variability in these storms.
That means it doesn’t explain 60 percent, or more than half. And, besides, it only takes one storm to knock down your beach house. Anyone living on a hurricane-prone shore knows the drill: Always keep a supply of canned or freeze-dried food on hand, make sure the car has a lot of gas, and if a big one threatens, secure your house as best as possible and get the hell out.
Klotzbach’s updated forecast that will come out in early August does explain more than half of the historical variability, but it’s doubtful anyone will change their vacation plans based upon it.
Knowledge is great, but more important is how useful it is.

